
In recent decades credit as an asset class has gone through long periods of prosperous years followed by shorter periods of very lean years. In many ways this is like the Biblical story of Joseph in Egypt, where Joseph set aside grain in the seven prosperous years in advance of the coming drought and the seven lean years. Investors in credit will also be well served to heed the warnings and make preparations in the prosperous years. Savvy investors can then respond like Joseph in Egypt, profiting handsomely in the lean years from reserves set aside in the prosperous years. Those who fail to heed the warnings and prepare may find that the lean years are fatal to their wealth, businesses and careers.
This article puts forward a framework for judging where we are at in the credit cycle. It lays out what each phase looks likes and then identifies where the credit cycle is currently at in the US and Australia. The article then goes on to explain what strategies investors should deploy in response to current market conditions, including how they can prepare and then profit by being positioned for potential future phases.
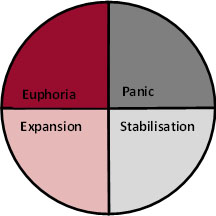
The Credit Cycle Clock Face
Over the last 30 years, credit has functioned in a cyclical fashion, with one phase gradually leading to the next just as the arms of a clock move from one hour to the next. The diagram below divides the credit cycle into four phases; panic, stabilisation, expansion and euphoria. Each phase brings different risks and opportunities. Investors seeking to maximise their long term returns and reduce their volatility should respond appropriately. This will often require action that is contrarian relative to their peers.

Before jumping into where different sectors are at, it is helpful to work through what each of the phases looks like. Whilst each cycle will have its own nuances which make it slightly different from previous iterations, the overall trends have been repeated many times over.
The Four Phases of the Credit Cycle
Panic Phase
In the panic phase, the overwhelming majority of investors are concerned about capital preservation and loss minimisation. As was the case in 2008 after the default of Lehman Brothers, the financial world has changed quickly and dramatically with a pervading fear amongst investors that credit markets can get far worse before they get better. Investors suddenly see risk around every corner with the dramatic increase in default rates (as much as ten times higher) causing the investors to constantly question who will be next to default.
Credit spreads widen dramatically (at least five times higher compared to the euphoric phase) with whole sectors indiscriminately sold off. Any credit that is perceived to be risky or complex will be most impacted by the sell-off, with credits commonly held by leveraged vehicles (think hedge funds and structured investment vehicles in 2008) also overwhelmed with sellers. Some investors panic and sell everything they can, which triggers further waves of selling as leveraged investors breach their covenants and become forced to liquidate. Some subordinated and long duration credits trade at the equivalent of a few years’ interest payments, with investors fearing that they are more likely to default than to reach maturity, or to be called by the issuer at par.
Stabilisation Phase
In the stabilisation phase, fear is beginning to recede but the wounds are still healing for many. There is a growing belief that the worst is over, but an expectation of occasional reversals as the credit markets gradually return towards “normal”. Credit spreads have tightened somewhat from the panic phase, but remain materially wider than historical averages. Investors start to differentiate between the quality of different issuers and security types within sectors. Low quality securities have become apparent by their default or restructuring, whilst high quality securities continue to meet their payment obligations. Investors receive great returns by holding almost any security that doesn’t default during this phase.
Expansion Phase
The expansion phase is what most investors would consider to be “normal” with credit spreads roughly in line with historical averages. Buyers slightly outnumber sellers, but not by so much that credits change hands at bullish prices on a widespread basis. Businesses are much more comfortable with issuing debt and demanding more flexible terms, with investors often accommodating of those requests for weaker covenants and security packages. Some investors begin to chase yield as they aim to maintain the returns of the stabilisation phase by pushing down the rating spectrum and dipping their toes in the water with more esoteric securities.
Euphoric Phase
Investors believe that this time is different and that large scale defaults will never occur again. Credit spreads are at or close to all-time lows but only a few investors question whether this is rational behaviour. Rather, commentators and investors will say that they believe credit is overvalued, but that there is no obvious trigger to change this so there is no need to fear the ever increasing risks. There is a bull rush for higher yielding investments with almost no issuer or structure too risky to be sold. Some investors look to increase returns by using leverage within their funds, often creating two or three layers of leverage between the original borrower and the ultimate investor.
Covenants and security packages are increasingly weak or non-existent, but long duration and perpetual securities flourish regardless. Issuance at B- and CCC ratings (borrowers with effectively no margin for error) forms more than 20% of total debt issuance, with payment in kind (PIK) and dividend recapitalisation deals also common place. Investors who don’t jump on these trends are considered unsophisticated and outdated. Their peers who do follow the trends are enjoying higher short term performance, attracting attention and winning acclaim for doing so. Only a few investors maintain their standards and don’t eventually cave in.
Two main limitations to this construct are worth noting briefly. Firstly, the cycle can occasionally reverse for short periods, typically months. Like equity markets, credit does not always or consistently trend upwards. However it is safe to say that over a longer period (usually a five to ten year business cycle) credit moves in a clockwise fashion through each phase with credit spreads tightening along the way until they reset wider at twelve o’clock. Secondly, the phases of the cycle may not be equivalent in length. It is possible for the cycle to pause at one phase for a prolonged period, or to rapidly advance through a phase. Notwithstanding these limitations, the Credit Cycle Clock Face is a helpful construct for understanding the cyclical nature of the credit cycle.
Where are the US and Australian Credit Markets at?
Having covered the four phases of the cycle and what each phase looks like, the relative progression of the US and Australian credit markets can be reviewed. Historically the US has been a much more aggressive market, which resulted in widespread bailouts and bankruptcies of American banks, hedge funds and other credit investing vehicles in 2008 & 2009. Australian credit investors were not as risk tolerant in the years leading up to the credit crisis and therefore suffered far less as a result. No Australian banks failed or were recapitalised by the Australian government, and the Australian economy as a whole avoided recession.
Where is the US at?
Key indicators in the US during 2013 include record or near record issuance volumes in both leveraged loans and high yield bonds1. Covenant light loans formed almost 60% of total issuance, an all-time record by no small margin2. Payment in kind volumes were not far off 2007 and 2008 levels, though there are some arguments that this vintage is less risky than 2007 as there is a level of restriction on when interest payments can be deferred3. Debt/EBITDA leverage on middle market deals is at record levels4, but the large cap deals are still a little below the 2006 and 2007 high marks. US high yield credit spreads are below average at just under 4%, but not yet below the 3% level they were for most of 20075. The record high mark for spreads of 22% in 2009 is a distant memory for most.
On the esoteric front, CLO volumes fell a little short of 2006 and 2007 levels, but are clearly at boom time levels with 2013 volumes more than double the combined total for 2008-2011 years6. Synthetic CDOs are making a comeback7 and Bank of America Merrill Lynch has just started an index for tracking Contingent Capital (CoCo) securities8. Student loans are tipped by some to be the sequel to subprime securitisations, with the combination of high debt loads and poor job prospects making the future servicing of many loans look dubious at best. Anecdotal evidence of mis-selling of high rate loans and lax lending standards, combined with default rates in the early years of 10-15% looks eerily familiar9.
Taking into account the above, I’m seeing the US credit cycle as currently being in the early stages of the euphoric phase, at around ten o’clock.
Where is Australia at?
Australia by comparison remains relatively subdued. Leveraged loan volumes remain light and whilst pricing has tightened a little from post 2008 levels it is still nowhere near the 2006 lows. Covenants and security packages have seen very little slippage and remain far stronger than in the US. Bond issuance has picked up noticeably and pricing has tightened, but the boundary pushing seven year BBB rated transactions show how tame Australian institutional investors are relative to their peers overseas. The riskiest sector looks to be the listed note market, where low interest rates have led to unsophisticated buyers taking on increasingly subordinated, perpetual and discretionary pay securities. The average margin over bank bills at 3.08% is a long way away from the 2009 levels.
Esoteric securities are also fairly subdued, with securitisation volumes doubling from 2012 levels but still only around half the levels of 2004-710. Margins tightened a little in 2013, but are nowhere near the tights from 2006 and 2007. The underlying loan quality for residential mortgages has slipped somewhat in the last year, as banks are becoming increasing comfortable with 95% LTV ratios when mortgage insurance is included. However, a good share of non-bank originators are being more conservative and applying the lessons learnt from the credit crisis. The potential for a housing bubble is commonly discussed. However, whilst housing prices can been seen as excessive the ability of borrowers to service their debts remains healthy without a substantial and sustained increase in unemployment.
Joining together the above data points and observations, I’m seeing Australia in the early stages of the expansion phase at around seven o’clock.
So now we have a view on the US and Australia’s position in the credit cycle, the natural question is: How should a credit investor best position themselves for the future?
Responding to the Four Phases of the Credit Cycle
Responding to the Panic Phase
In the panic phase, liquidity is difficult to find, and very expensive when it can be found. Liquidity in esoteric securities typically disappears completely. As a result, investors are generally better off to let their existing securities mature rather than looking to cross the liquidity gap for relative value trades. The main exception is selling short dated securities at a small discount to par, to cycle into longer dated or lower rated securities that trade at very substantial discounts to par.
Investors with limited risk appetite should concentrate on senior secured debt of “hard asset” companies such as operating infrastructure and property with predictable long term demand or contracts. These will typically have very limited downside but material upside. Investors with greater risk appetite and who prepared well in the euphoric phase will transition to vulture mode, taking advantage of the many distressed sellers by offering liquidity but at enormous discounts to par.
Primary issuance is minimal with few companies willing to risk the stigma of sounding the market and then failing to raise debt. Issuers take time to adjust to much higher margins and fees demanded by buyers, but for those with imminent maturities they have to choose between paying up to raise debt or issuing new equity. Complicated structures and highly leveraged issuance is virtually impossible, with the market overwhelmed with secondary sellers in these sectors. Simple structures and investment grade issuance is the order of the day.
Covenants and security packages will very much favour the buyers, with those willing to cornerstone transactions having a very strong ability to influence the key terms. Whilst the quantity of issuance is low, the quality is very high with very few weak transactions issued at this part of the cycle. For long term buyers almost every new deal represents good long-term buy and hold value, and usually exceptional relative value as issuers must pay a premium to attract the few investors who have the liquidity and fortitude to buy into primary issuance.
Responding to the Stabilisation Phase
Liquidity begins to meaningfully return, although it is not yet cheap and therefore trades must have a solid justification to be considered. Investment grade and short dated instruments remain the most easily traded, but liquidity on the more popular high yield names is noticeably improved. Esoteric structures continue to trade by appointment, with selected buyers offering liquidity but still demanding substantial discounts on the price in return.
Primary issuance meaningfully returns for investment grade and BB rated credits. Terms and conditions favour the lenders, but issuers are starting to ask for more flexibility in pricing and terms. The correct response is to offer a little discount on pricing but to hold strong on covenants and security packages. Roughly 80% of primary issuance is very good long-term value.
At this part of the cycle, moving down the credit spectrum will be substantially rewarded in the medium and long term. Short dated and maturing credits can be replaced with longer dated or even perpetual structures from cashflow positive companies. Targeting well performing esoteric structures, which are still trading at large discounts to par, can result in substantial capital gains in the medium term. These deals will usually price more like perpetual securities than term instruments, but when the cycle moves to the expansion phase they are often redeemed or bought back by the issuer at a lesser discount to par. However, be wary of deals with euphoric phase margins and perpetual structures where there is no economic incentive for a call.
Responding to the Expansion Phase
Liquidity is now good, with both buyers and sellers finding that vanilla deals trade very easily and esoteric deals have multiple buyers and sellers. Fresh buyers emerge as new funds are started, with existing funds attracting more capital and being given more flexibility in their allowable investments. Credits bought during the panic and expansion phases will continue to mature or be redeemed with capital gains crystallised and the proceeds available for re-investment. Roughly 50% of all primary issuance is good long-term value, with the seeds of the next wave of distressed credits starting to be sown in the other 50%.
The expansion phase lends itself to investing in most types of credit, but with fundamental analysis remaining the key to solid long term returns. High yielding credits rated around BB remain good value, particularly when solid covenants and security packages are included. Be wary of the increasing proportion of debt issuance at B- and CCC ratings, where the ability of the issuer to service interest is speculative in the best of times. In these deals the borrower is completely reliant upon refinancing or equity solutions to meet their maturities, rather than having at least some debt amortisation. Other areas to avoid are perpetual and very long tenor securities, and transactions that have equity like payment and maturity features such as preference shares and contingent securities.
Responding to Euphoric Phase
Liquidity is now strong across all security types, with esoteric and long dated securities trading as easily as vanilla securities did in the expansion phase. New buyers are flooding into the markets with many potential buyers either receiving very low allocations or missing out altogether when primary and secondary deals are offered for sale. This feeds the seemingly relentless tightening of credit spreads with previously disappointed investors bidding higher, determined not to miss out again. Investors seeking to exit securities can do so quickly and at very little cost. Less than 20% of new issuance is good long-term value.
Credit investors will suffer short term pain but will be rewarded with long term gains by pursuing a contrarian strategy. The market pays little extra yield for moving down the credit spectrum or giving up tenor, covenants or structural features. Credit investors should respond by moving up the ratings spectrum, trading up to senior securities from subordinated debt or preference shares and sticking to shorter dated securities. Strategies focussed on relative value switches should be profitable and can be used to de-risk the portfolio at limited cost. Underperforming companies should be removed immediately.
Selected esoteric securities and shorter dated BB rated credits still offer good value, but buyers must consider that these may quickly become illiquid if the credit cycle moves on. Given the low reward for risk, staying in cash can be a better long-term strategy than being invested. The option value of being liquid in the panic phase is always drastically underestimated in the euphoric phase.
Conclusion
With the US credit markets now in the euphoric phase, investors should be taking action to de-risk their portfolios. The medium term is likely to bring a pull-back in pricing and the availability of liquidity and an increase in default rates. The relatively small under-performance from preparing now in the prosperous years should be made up many time overs when the lean years come and capital is available to be deployed at a far lower entry point.
Investors in Australian credit should continue to prudently add to their positions, particularly in non-LMI securitisation and BB rated loans. Selective de-risking of portfolios is also appropriate, particularly perpetual and longer tenor securities that have done very well in the last three years, and selling out of almost all listed notes. Whilst Australian investors can take a level of comfort that credit is generally not overpriced, it is worth watching where the relative position of the US and emerging markets are at. If those markets switch to the panic phase, Australia will be dragged down with them.
References
- S&P Capital IQ
- http://www.ft.com/intl/cms/s/0/8f57cea0-6f0a-11e3-bc9e-00144feabdc0.html#slide4
- http://www.forbes.com/sites/spleverage/2013/10/28/high-yield-bonds-pik-toggles-surge-but-with-tighter-terms-than-pre-crisis-era/
- http://www.forbes.com/sites/spleverage/2013/10/07/middle-market-issuers-load-up-on-debt-amid-hot-leveraged-loan-market/?goback=%2Egde_2092432_member_5793078671036145666#%21
- http://research.stlouisfed.org/fred2/series/BAMLH0A0HYM2
- http://www.forbes.com/sites/spleverage/2014/01/02/2013-clo-issuance-hits-81-9b-most-since-2007/?goback=%2Egde_64493_member_5824536038978121730#%21
- http://www.ft.com/intl/cms/s/0/1d2d33d8-5ba5-11e3-848e-00144feabdc0.html#axzz2r00uvp2B
- http://www.bloomberg.com/news/2014-01-09/bank-america-compiles-coco-bond-index-as-class-enters-mainstream.html
- http://www.ed.gov/news/press-releases/default-rates-continue-rise-federal-student-loans
- http://www.securitisation.com.au/marketsnapshot